

Empire Crypto: Ultimate Guide to Crypto Market Fundamentals
Navigating digital assets requires moving beyond hype, social media trends, and short-term speculation. Understanding how to evaluate projects using verified crypto data provides a major analytical advantage. Empire Crypto delivers the framework needed to evaluate networks, decode tokenomics, and interpret cryptocurrency market data accurately.

What Are Crypto Market Fundamentals?
Market fundamentals represent the core quantitative and qualitative metrics that determine an asset’s intrinsic value. Unlike traditional financial markets that rely on corporate quarterly earnings, digital asset valuation requires analyzing decentralized protocols, smart contract security, and on-chain activity.
When analyzing digital assets, Empire Crypto evaluates four fundamental pillars:
- Economic Structure: Inflation schedules, supply caps, and token distribution models.
- Network Activity: Active wallet addresses, total value locked (TVL), and transaction volume.
- Protocol Revenue: Fees generated by smart contracts and distributed to stakeholders.
- Development Metrics: Code commit frequency, developer retention, and active repositories.
Evaluating these pillars using accurate cryptocurrency data helps separate high-utility protocols from speculative tokens.
Core Valuation Metrics Every Trader Must Know
Evaluating tokens requires looking beyond unit price. Focusing solely on nominal price often creates a false perception of value.
Market Capitalization vs. Fully Diluted Valuation (FDV)
- Market Capitalization: Calculated as
Current Price × Circulating Supply. Represents the current liquid market value. - Fully Diluted Valuation (FDV): Calculated as
Current Price × Maximum Supply. Indicates total market cap once all planned tokens enter circulation.
A substantial gap between Market Cap and FDV indicates future token unlocks. If a project has a $100M Market Cap but a $2B FDV, upcoming supply releases could create downward price pressure unless demand scales proportionally.
Volume-to-Market Cap Ratio
This liquidity metric is calculated by dividing 24-hour trading volume by total market capitalization.
A ratio above 0.10 signals high market liquidity and steady trading interest. A ratio below 0.02 suggests low volume, making larger orders susceptible to slippage.
Total Value Locked (TVL)
Commonly used in decentralized finance (DeFi), TVL measures the aggregate capital deposited into a protocol’s smart contracts. Relying on reliable data crypto feeds allows traders to track TVL movements across liquidity pools, lending markets, and yield strategies.
Demystifying Tokenomics & Supply Dynamics
Tokenomics defines the economic rules governing a cryptocurrency’s supply, distribution, and incentive structure. Empire Crypto structures tokenomics evaluations around three main supply metrics:
| Supply Metric | Definition | Practical Valuation Impact |
| Circulating Supply | Tokens publicly available and actively moving in the market. | Determines immediate market cap and circulating liquidity. |
| Total Supply | Total tokens created minus burned or permanently removed coins. | Shows total existing supply, including locked staking pools. |
| Max Supply | Hard-coded limit of tokens that will ever exist. | Establishes absolute scarcity (e.g., Bitcoin’s 21M hard cap). |
Emission Schedules and Cliff Unlocks
Token releases often follow predefined vesting schedules. When early investors or team members reach a cliff unlock, large token volumes enter circulation. Tracking unlock schedules via empire crypto analytics prevents buying assets right before massive secondary supply dilutions hit exchanges.
On-Chain Metrics: Evaluating Network Health
Blockchain transparency provides real-time access to ledger activity. Utilizing data analytics cryptocurrency tools makes it possible to audit network adoption without relying on third-party financial reporting.
Daily Active Addresses (DAUs)
Tracking unique wallet interactions per day offers a proxy for user adoption. Sustainable protocol growth generally corresponds to a steady rise in active wallet addresses over time.
NVT Ratio (Network Value to Transactions)
The NVT ratio functions similarly to traditional price-to-earnings (P/E) ratios:
$$\text{NVT Ratio} = \frac{\text{Market Capitalization}}{\text{Daily On-Chain Transaction Volume}}$$
- High NVT: Indicates valuation is outpacing actual on-chain transaction volume, signaling potential overvaluation.
- Low NVT: Suggests high transaction throughput relative to market cap, highlighting a potential buying opportunity.
Quantitative Analysis Framework by Empire Crypto
Evaluating cryptocurrencies systematically requires a standardized analytical approach. Empire Crypto utilizes a structured quantitative scoring framework:
Fundamental Scoring Model
- Revenue vs. Emissions Audit: Compare monthly protocol revenues against token emission costs. Protocols where emissions exceed revenue often face inflation pressure.
- Holder Distribution Analysis: Evaluate wallet concentration. If top non-exchange wallets hold over 50% of supply, centralization risk increases.
- Developer Activity Metrics: Check active monthly GitHub commits to verify ongoing maintenance and feature development.
Applying this framework using best crypto data sources helps isolate sustainable projects from inflationary hype cycles.
Utilizing Data Tools and Analytics Solutions
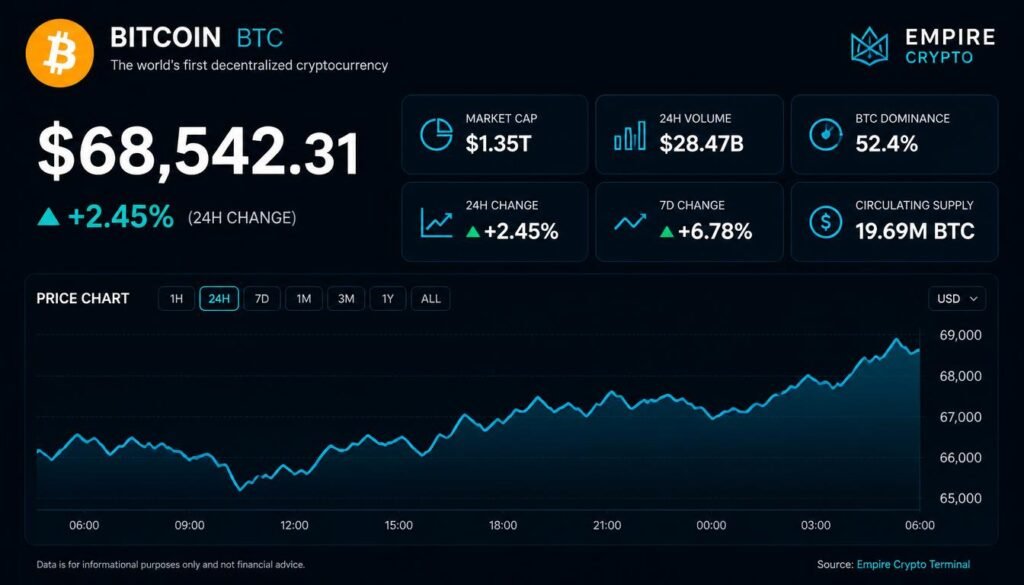
Navigating crypto markets effectively requires leveraging established crypto data solutions. Modern market analysis relies on specialized data platforms:
- Market Aggregators: Provide real-time exchange liquidity tracking, pair order books, and price aggregation across venues.
- DeFi Tracking Platforms: Offer granular data on smart contract protocol fees, DEX volumes, and cross-chain bridge movements.
- On-Chain Data Platforms: Track miner balances, exchange net inflows/outflows, and long-term investor holding behavior.
Using reliable crypto market data protects against manipulated trading volume, artificial wash trading, and distorted market stats.
Qualitative Fundamentals: Beyond the Numbers
While quantitative metrics are essential, qualitative factors provide critical context regarding project sustainability.
Team Credibility and Execution
Evaluate the founding team’s track record, technical background, and previous project executions. Open-source development with visible code commits builds greater credibility than fully anonymous teams with closed repositories.
Whitepapers and Technical Roadmaps
A project whitepaper should detail the underlying technology architecture, consensus mechanism, security trade-offs, and economic problem the token solves. Empire Crypto highlights the importance of matching whitepaper promises against operational code deployments.
Regulatory Compliance and Security Audits
Smart contracts should undergo security audits by independent, recognized auditing firms. Verifying audit reports ensures protocol code has been checked for reentrancy bugs, flash loan vulnerabilities, and admin key risks.
Step-by-Step Guide: Fundamental Due Diligence
Applying market analysis principles requires a repeatable execution methodology:
1. Verify Tokenomics and Supply Dynamics: Examine the supply cap, circulating supply ratio, and unlock schedules using verified crypto data resources. Identify upcoming cliff events that could dilute circulating token value.
2. Analyze On-Chain Usage & Protocol Revenue: Track active daily wallet addresses, transaction fees, and revenue models. Confirm that network activity is driven by organic users rather than short-term yield incentives.
3. Audit Developer Activity & Code Commits: Review public repositories on GitHub to measure active developer contributions, code updates, and technical maintenance frequency over time.
4. Review Smart Contract Audits & Security: Confirm that smart contracts have passed security audits from reputable third-party security firms. Verify that multsig setups and admin key privileges are documented clearly.
Advanced Crypto Market Data Strategies
Experienced market participants combine multiple data metrics to identify market shifts and mispriced assets.
Identifying Divergences Between Usage and Price
A classic market opportunity occurs when a protocol’s fundamental usage metrics (e.g., active wallets, fee revenue, TVL) increase while its token price consolidates or trends downward. Identifying these fundamental divergences early provides an analytical edge.
Exchange Net Flows Analysis
Monitoring exchange wallets offers insights into potential supply dynamics:
- Net Inflows: Large token transfers moving onto centralized exchanges suggest potential selling pressure.
- Net Outflows: Tokens moving off exchanges into self-custody or cold storage indicate long-term holding behavior and reduced liquid market supply.
Frequently Asked Questions (FAQ)
What makes Empire Crypto data solutions unique?
Empire Crypto delivers clean, institutionally vetted data feeds that filter out wash trading, false exchange volume, and distorted metrics.
How do I evaluate crypto market data as a beginner?
Start by checking basic metrics: Market Cap, 24-hour Trading Volume, Circulating Supply, and Fully Diluted Valuation (FDV). Using verified data platforms prevents relying on distorted information.
Why is cryptocurrency data reliability crucial for fundamental analysis?
Clean data prevents miscalculations caused by inflated DEX volumes or wash trading. Reliable analytics ensure fundamental models reflect actual economic activity.
Conclusion
Understanding crypto market fundamentals is essential for navigating digital asset markets with clarity. By evaluating market caps, tokenomics, on-chain metrics, and technical development, investors can separate sustainable networks from speculative hype.
Empire Crypto provides the analytical frameworks, institutional-grade tools, and reliable crypto data solutions required to evaluate decentralized protocols confidently. Combine continuous research, proper risk management, and verified data analytics to make informed decisions across market cycles.
About The Author
