

Crypto Data Online Easy Way to Understand Blockchain
Understanding blockchain through online crypto data doesn’t require a degree in computer science. At its core, a blockchain is simply a public ledger—a shared, unalterable receipt book that lives on the internet. Because every single transaction is completely public, Crypto Data Online can audit the data in real time.
This guide breaks down how to read online crypto data, translates complex network concepts into everyday language, and introduces the best free tools to help you view the inner workings of a blockchain.
1. The Blueprint: Demystifying Blockchain Data
To understand the data you see on crypto tracking sites, it helps to understand the physical architecture of a blockchain. A blockchain relies on three foundational elements to maintain its data:
The Distributed Ledger
In traditional finance, your bank holds a private ledger (a master list) of who owns what. If the bank’s servers go offline or get hacked, the system fails. A blockchain replaces this with a Distributed Ledger.
Instead of one central bank, thousands of independent computers (called nodes) all over the world maintain an identical copy of the exact same spreadsheet. Every time a transaction occurs, every single node updates its ledger simultaneously.
Blocks and Hashes
Transactions are not processed one by one; they are batched together into Blocks. Think of a block as a single page in a receipt book. Once a page is full of transactions, it is sealed with a unique digital fingerprint called a Cryptographic Hash.
What makes it a chain is that each new block contains the fingerprint of the previous block. This creates an unbreakable chronological link.
[ Block 1 ]                  [ Block 2 ]                  [ Block 3 ]
- Tx Data                    - Tx Data                    - Tx Data
- Hash: 0001a   <--------->  - Prev Hash: 0001a           - Prev Hash: 0002b
                             - Hash: 0002b   <--------->  - Hash: 0003c
Immutability
Because every block is mathematically locked to the one before it, you cannot alter the past. If a bad actor tries to alter a transaction in Block 1, its hash changes. That breaks the link to Block 2, and the rest of the network instantly rejects the tampered copy as invalid. This absolute permanence is called Immutability.
2. Navigating a Block Explorer: The Web3 Search Engine
The absolute easiest way to view raw blockchain data is through a Block Explorer. These are free, open-access websites that act like a Google search engine for a specific blockchain network. The most popular include Etherscan (for Ethereum), Solscan (for Solana), and Blockchain.com (for Bitcoin).
When you open a block explorer, you are greeted with a fast-moving wall of text and numbers. Here are the core metrics you need to know:
- Transaction Hash (TxHash): A unique alphanumeric string assigned to every transaction. It serves as a digital tracking receipt.
- From / To Addresses: Cryptographic wallet public keys showing exactly where the capital originated and where it landed.
- Gas / Transaction Fees: The small fee paid to the network’s validators to reward them for processing your data.
Here is how you can use an explorer to audit a transaction step by step:
1.Copy a public transaction hash:Locate the String.
Obtain a unique Transaction Hash (TxHash) from your wallet history, an exchange withdrawal log, or a public treasury page.
2.Query the block explorer:Execute Search.
Navigate to the search bar of the corresponding network explorer (e.g., Etherscan.io for Ethereum) and paste the TxHash.
3.Check the status indicator:Verify Finality.
Look at the Status field. If it reads Success, the data is permanently locked into the ledger. If it reads Pending, it is still waiting in the network’s temporary memory pool (mempool) to be validated.
4.Review the wallet addresses:Analyze Capital Flow.
Examine the Value field to see the exact amount transferred, and audit the From and To strings to track the capital flow.
3. The Pillars of On-Chain Analytics
Traditional stock market analysis looks at price charts and corporate earnings reports. Blockchain analytics looks at On-Chain Data—the raw user behavior recorded directly onto the public ledger.
By aggregating millions of transactions into visual charts, platforms like Glassnode, CryptoQuant, and Dune Analytics help you see exactly how investors are behaving.
               ┌──────────────────────────────┐
               │    ON-CHAIN ANALYTICS        │
               │  (Verifiable Ledger Data)    │
               └──────────────┬───────────────┘
                              │
       ┌──────────────────────┼──────────────────────┐
       ▼                      ▼                      ▼
┌──────────────┐       ┌──────────────┐       ┌──────────────┐
│ EXCHANGE     │       │ NETWORK      │       │ WALLET       │
│ FLOWS        │       │ HEALTH       │       │ CONCENTRATE  │
│ Inflows vs   │       │ Active Addr, │       │ Whales vs    │
│ Outflows     │       │ Hash Rate    │       │ Retail       │
└──────────────┘       └──────────────┘       └──────────────┘
When analyzing on-chain data, beginners should focus on three primary categories:
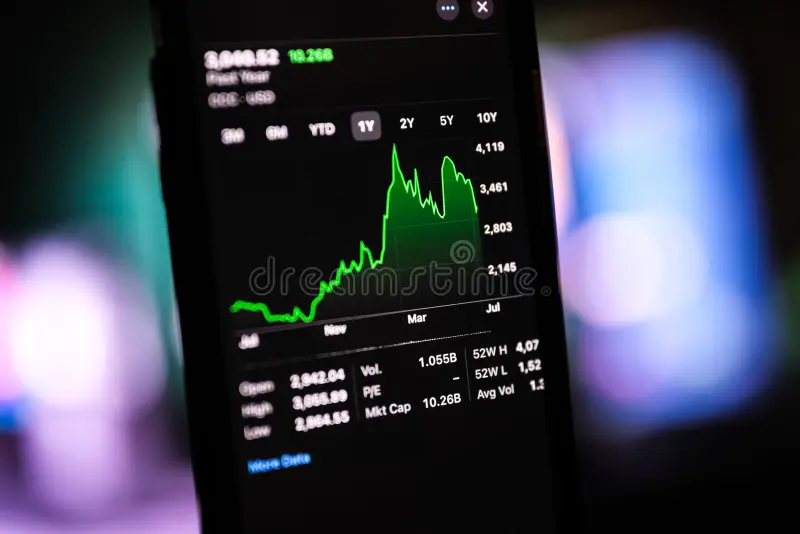
A. Exchange Flows (Tracking Supply Inflows and Outflows)
Centralized crypto exchanges (like Coinbase or Binance) maintain their own massive, identifiable public wallet clusters. Tracking the movement of funds into and out of these Crypto Data Online wallets provides a clear look at market sentiment:
- Exchange Inflows: When massive amounts of crypto move into an exchange from private user wallets, it usually indicates that investors are getting ready to sell their assets. This increases market sell pressure.
- Exchange Outflows: When crypto moves out of an exchange and into cold storage (private self-custody wallets), it implies that investors plan to hold their assets long-term. This reduces the circulating supply available for purchase, creating a supply shock.
B. Network Health Metrics
A blockchain’s value relies directly on its security and usage. You can easily gauge this through two public metrics:
- Active Addresses: The total number of unique wallet addresses participating in transactions daily. A steady upward trend in active addresses indicates healthy network growth and real user adoption.
- Hash Rate: For networks like Bitcoin, the hash rate measures the total computational energy being used by global miners to secure the network. A rising hash rate means the network is growing more secure and resistant to outside attacks.
C. Wallet Concentration (Tracking the “Whales”)
Large holders who own massive percentages of a token’s total supply are known as Whales. Because their large trades can drastically swing prices, tracking them is essential.
Tools like Bubblemaps and Arkham Intelligence let you visually see if a cryptocurrency is safely decentralized across millions of small retail users, or dangerously centralized in a few interconnected whale wallets.
4. Essential Advanced On-Chain Indicators
As you get more comfortable reading data charts, you will see analysts refer to macro indicators that evaluate whether a cryptocurrency is overvalued or undervalued relative to its historical usage. Here are the three most reliable macro data models broken down simply:
| Indicator Name | What It Stands For | The Core Concept | How to Read It |
| MVRV Ratio | Market Value to Realized Value | Compares the token’s current trading price to the average price at which all tokens last moved on-chain. | Below 1.0: The asset is deeply undervalued; most holders are sitting on unrealized losses. Above 3.0: The asset is historically overvalued; high risk of market profit-taking. |
| NVT Ratio | Network Value to Transactions | Often called the “P/E Ratio of Crypto.” It divides the total market value by the daily transactional dollar volume passing through the ledger. | High NVT: The asset price is soaring, but very little actual economic value is moving through the network—a sign of pure speculative hype. Low NVT: The network is handling massive transaction volumes relative to its price—a sign of organic value. |
| SOPR | Spent Output Profit Ratio | Measures whether tokens moving on a given day are being sold at a profit or a loss compared to when they were acquired. | Above 1.0: The average user is selling their tokens for a profit. Below 1.0: The average user is capitulating and selling at a loss, often marking market bottoms. |
5. Free Online Tools to Start Learning Today
You don’t need expensive institutional software to access this data. The decentralized ecosystem offers exceptional, free toolkits for learning and analysis:
CoinGecko & CoinMarketCap
- Best For: Initial market asset screening and supply tracking.
- What you learn: These aggregators teach you the crucial difference between Circulating Supply (tokens currently open for public trading) and Max Supply (the ultimate mathematical limit of a coin that can ever exist). Learning to track these figures protects you from inflation or dilution surprises down the road.
DeFiLlama
- Best For: Tracking decentralized applications and protocols.
- What you learn: DeFiLlama tracks Total Value Locked (TVL)—the total amount of capital actively deposited inside a network’s smart contracts. TVL is an incredibly reliable measure of a network’s commercial utility.
Dune Analytics
- Best For: Custom, open-source dashboard communities.
- What you learn: Dune allows analysts worldwide to write open SQL database queries directly against raw blockchain transaction logs. For beginners, this means you can browse thousands of beautiful, free, community-built visual dashboards tracking everything from NFT trends to active gas consumption metrics.
Summary Principles for the Beginner Analyst
The beauty of blockchain is its radical transparency. By shifting your focus from social media hype to public ledger facts, you avoid the emotional noise of the markets.
Always cross-reference developer claims using a public block explorer, monitor exchange flows to watch what the largest whales are doing with their funds, and track organic adoption metrics like active addresses to make sure the network has real utility.
About The Author
